
Author: dustin
Programmatically-Driven Websites in Python (with HTTPHandler and SO_LINGER)
We’re going to write a website whose requests are handled by subroutines, and use Python’s logging.handlers.HTTPHandler class to send requests to it. Documentation and/or examples for the former are sparse, and I thought that an example of the latter connecting to the former would be useful.
Understanding the Webserver
Using the built-in BaseHTTPServer.BaseHTTPRequestHandler webserver, you can wire methods for individual verbs (GET, POST, PUT, etc..). Requests on verbs that aren’t handled will return a 501. Aside from having to write the headers at the top of the methods yourself and needing to read a specific quantity of data-bytes (or you’ll block forever), this is similar to every other web-framework that you’ve used.
The only things that you really need to know are the following instance variables:
- headers: A dictionary-like collection of headers.
- rfile: A file-like object that will contain your data (if you receive any).
- wfile: A file-like object that will receive your response data (if you send any).
You’ll also need to deal with how to handle unsent data when you terminate. Even if you shutdown a socket, it may not be closed by the system immediately if data has already moved across it. This relates to why we inherit from SocketServer.TCPServer and change the one class variable. We’ll discuss this more, below.
import pprint
import urlparse

import BaseHTTPServer
import SocketServer

_PORT = 8000


class TCPServerReusableSocket(SocketServer.TCPServer):
    allow_reuse_address = True


class HookedHTTPRequestHandler(BaseHTTPServer.BaseHTTPRequestHandler):
    def __send_headers(self):
        self.send_response(200)
        self.send_header("Content-type", 'text/plain')
        self.end_headers()

    def do_GET(self):
        self.__send_headers()

        print("Received GET request for: %s" % (self.path,))

        self.wfile.write("Test from GET!\n")

    def do_POST(self):
        self.__send_headers()

        print("Received POST request for: %s" % (self.path,))

        print('')
        print('Headers')
        print('=======')
        pprint.pprint(self.headers.items())
        print('=======')

        length = int(self.headers['content-length'])
        data_raw = self.rfile.read(length)
        data = urlparse.parse_qs(data_raw)

        print('')
        print('Received')
        print('========')
        pprint.pprint(data)
        print('========')
        print('')

        self.wfile.write("Test from POST!\n")

httpd = TCPServerReusableSocket(
            ('localhost', _PORT),
            HookedHTTPRequestHandler)

httpd.serve_forever()
We expect that what we’ve done above is fairly obvious and does not need an explanation. You can implement your own log_request(code=None, size=None) method in HookedHTTPRequestHandler to change how the requests are printed, or to remove them.
To continue our remarks about buffered-data above, we add special handling so that we don’t encounter the “socket.error: [Errno 48] Address already in use” error if you kill the server and restart it a moment later. You may choose one of the following two strategies:
- Force the socket to close immediately.
- Allow the socket to already be open.
(1) should be fine for logging/etc. However, this might not be a great option if you’re handling actual data. (2) should probably be the preferred strategy, but you’ll also have to be sure to implement a PID file in your application so that you can be sure that only one instance is running (assuming that’s desired).
To implement (2), use SocketServer.TCPServer instead of our custom TCPServerReusableSocket. and, add the following imports:
import socket
import struct
Then, add the following after we define httpd but before we start the server, to tell the SO_LINGER socket option to kill all buffered data immediately:
l_onoff = 1
l_linger = 0

httpd.socket.setsockopt(socket.SOL_SOCKET, socket.SO_LINGER, struct.pack('ii', l_onoff, l_linger))
You can test this using cURL, if you can’t wait to setup HTTPHandler:
$ curl -X POST -d abc=def http://localhost:8000
Test from POST!
The webserver process will show:
$ python http_server.py
127.0.0.1 - - [19/Oct/2014 15:28:47] "POST / HTTP/1.1" 200 -
Received POST request for: /

Headers
=======
[('host', 'localhost:8000'),
 ('content-type', 'application/x-www-form-urlencoded'),
 ('content-length', '7'),
 ('accept', '*/*'),
 ('user-agent', 'curl/7.30.0')]
=======

Received
========
{'abc': ['def']}
========
Understanding logging.handlers.HTTPHandler
My own use-case for this was from a new MapReduce platform (JobX), and I wanted to potentially emit messages to another system if certain tasks were accomplished. I used the built-in webserver that we invoked, above, to see these messages from the development system.
import logging
import logging.handlers

logger = logging.getLogger(__name__)

_TARGET = 'localhost:8000'
_PATH = '/'
_VERB = 'post'

sh = logging.handlers.HTTPHandler(_TARGET, _PATH, method=_VERB)

logger.addHandler(sh)
logger.setLevel(logging.DEBUG)

logger.debug("Test message.")
This will be shown by the webserver:
127.0.0.1 - - [19/Oct/2014 15:45:02] "POST / HTTP/1.0" 200 -
Received POST request for: /

Headers
=======
[('host', 'localhost'),
 ('content-type', 'application/x-www-form-urlencoded'),
 ('content-length', '368')]
=======

Received
========
{'args': ['()'],
 'created': ['1413747902.18'],
 'exc_info': ['None'],
 'exc_text': ['None'],
 'filename': ['push_socket_log.py'],
 'funcName': ['<module>'],
 'levelname': ['DEBUG'],
 'levelno': ['10'],
 'lineno': ['17'],
 'module': ['push_socket_log'],
 'msecs': ['181.387901306'],
 'msg': ['Test message.'],
 'name': ['__main__'],
 'pathname': ['./push_socket_log.py'],
 'process': ['65486'],
 'processName': ['MainProcess'],
 'relativeCreated': ['12.6709938049'],
 'thread': ['140735262810896'],
 'threadName': ['MainThread']}
========
Note that each field is a list with one item. If you want the output to look a little nicer, alter the above to add the following to the top of the module:
import datetime

_FMT_DATETIME_STD = '%Y-%m-%d %H:%M:%S'
Then, add the __print_entry method:
    def __print_entry(self, entry):
        created_epoch = float(entry['created'][0])
        when_dt = datetime.datetime.fromtimestamp(created_epoch)
        timestamp_phrase = when_dt.strftime(_FMT_DATETIME_STD)
        where_name = entry['name'][0][:40]
        level_name = entry['levelname'][0]

        message = entry['msg'][0]

        print('%s  %40s  %9s  %s' %
              (timestamp_phrase, where_name, level_name, message))
Then, change the last part of do_POST:
    def do_POST(self):
        self.__send_headers()

        length = int(self.headers['content-length'])
        data_raw = self.rfile.read(length)
        data = urlparse.parse_qs(data_raw)

        self.__print_entry(data)
The output will now look like:
2014-10-19 16:16:00       MR_HANDLER.HTTP.map_obfuscation_one       INFO  Socket message!
2014-10-19 16:16:00                           MR_HANDLER.HTTP      ERROR  Mapper invocation [789b7ca7fcb6cede9ae5557b2121d392469dfc26] under request [85394d5bdb34a09ffa045776cc69d1d4cd17d657] failed. HANDLER=[map_obfuscation_one]
There is one weird thing about HTTPHandler, and it’s this: Many/all of the fields will be stringified in order to serialized them. If you call the logger like logging.debug('Received arguments: [%s] [%s]', arg1, arg2), then we’ll receive Received argument: [%s] in the msg field (or rather the msg list), and the arguments as a stringified tuple like (u'abc', u'def'). To avoid dealing with this, I’ll send messages into a function that’s in charge of the notifications, and produce the final string before I send it to the logger.
The same thing applies to tracebacks. If you log an exception, you’ll only get this:
 'exc_info': ['(<type 'exceptions.NameError'>, NameError("global name 'client_id' is not defined",), <traceback object at 0x110c92878>)'],
 'exc_text': ['None'],
Again, you’ll have to concatenate this into the log-message by some intermediate function (so that the primary application logic doesn’t have to know about it, but so that you’ll still get this information).
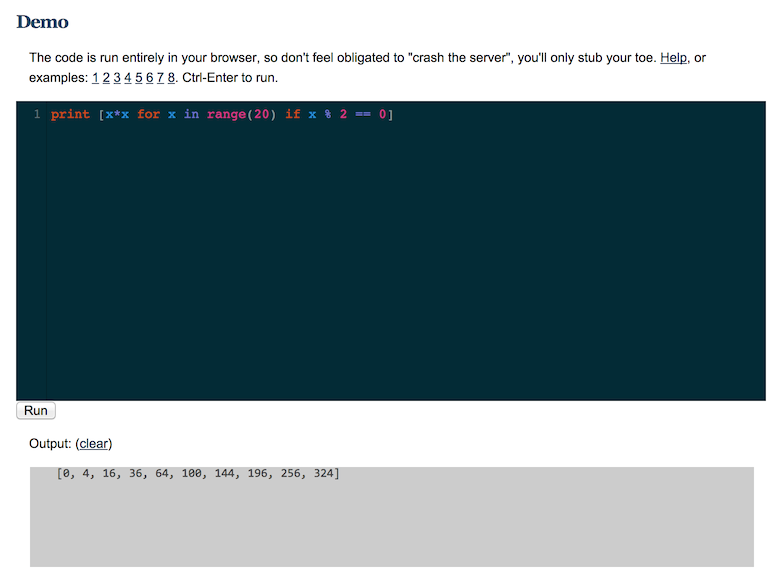
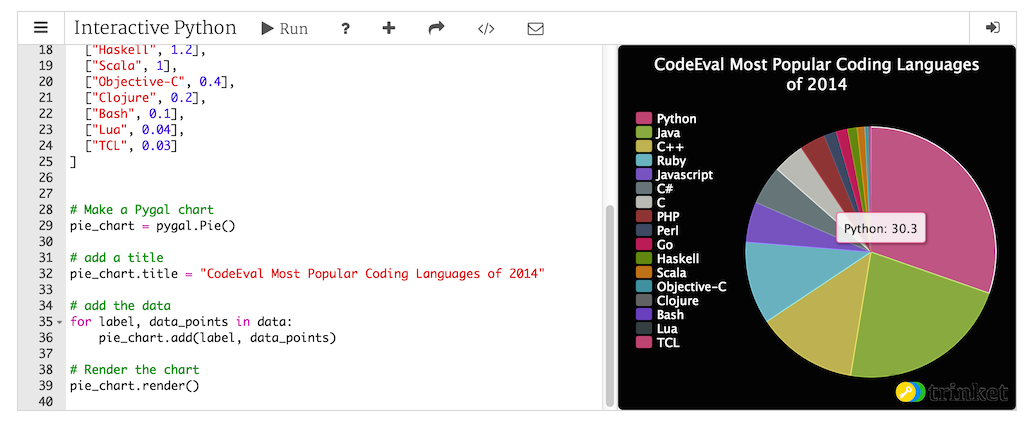
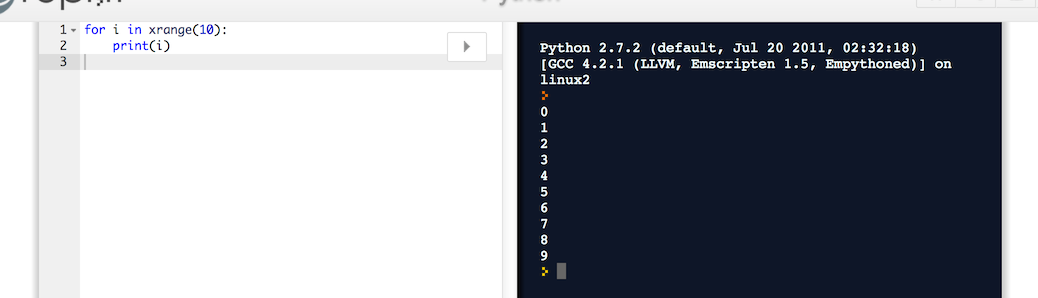
Python In-Browser Javascript Implementation
Run Python completely in the browser with Skulpt:
trinket.io for interactive Python from a website:
Interactive [any language] interpreter from a website with repl.it:
Infinite, Secure, and Distributed Backups Using Tahoe
Thanks to zooko for this one: A secure, distributed storage-service built on top of S3, which uses Tahoe (see previous article) as its client. Your data is 100% encrypted locally before being pumped into S3. It’s called S4.
It’s $25/month for infinite storage. For those of us with mountains of data to backup, it’s a deal (S3 costs about $30/T, currently, and even Glacier is $10/T).
Once you setup your Tahoe client with the right introducer and share configuration (which is trivial), all you do is call the “backup” subcommand with the path that you want to backup.
Done (well, after potentially several weeks of backing-up it will be).
Intro to Docker, and Private Image Registries
Docker is an application hosting framework. It enables you to wrap virtual-machine containers around your applications and both manufacture and control them via API.
Docker allows you to bundle your dependencies/servers and your application into a thin image that is layered on top of another one (such as Ubuntu, or something more formally prepared for your needs). These are different than virtual machines, in that even though they are heavily isolated from the other processes in the system using LXC and cgroups (Linux concepts talked about in previous articles), they share the same resources and have almost no overhead. When you start a VM, you end up at a prompt or UI that is ready for you to install and start applications. When you start an application container, you run a script that starts your applications and dependencies, and nothing else. You can run a handful of VMs on a system, but a thousand application containers. If you want to streamline distribution, you can then consider using CoreOS to host your images at the OS-level.
Another feature that Docker contributes to containers is version control. You can commit any change that you’ve made to your container as a new image. You can obviously also start as many containers as you’d like from the same image (images themselves are immutable).
Your own process for distributing images to other teams or other companies might require a place to publish or coordinate your images beyond your current system. This is done via a Registry. Though Docker provides the public Docker Hub Registry, you may want a private Registry of your own for your company or development team.
Because the components/accessories of Docker are, themselves, often distributed as Docker images, this example has the second effect of showing you how easy it is to start a Docker-based application (in case you were unfamiliar, before). You don’t need to know anything about the guest application other than what ports its services are hosted on. In fact, you can start Docker images (which are then referred to as containers) that may be required for other Docker images, have Docker map random local ports to them, and then automatically forward ports from the containers that provide a service to the containers that depend on them (via a feature called linking).
Start your Registry using something similar to the example from the Registry project homepage:
$ docker run
         -e SETTINGS_FLAVOR=s3
         -e AWS_BUCKET=mybucket
         -e STORAGE_PATH=/registry
         -e AWS_KEY=myawskey
         -e AWS_SECRET=myawssecret
         -e SEARCH_BACKEND=sqlalchemy
         -p 5000:5000
         registry
This essentially sets six environment variables for the application that tell it to store into S3 and forward port 5000 from the host (local) system to port 5000 in the guest (Registry). “registry” is the name of the image to run (if it’s owned by a particular user, it’ll look like “/”). If it’s not already available locally, it’ll be located and pulled. If not further qualified with a registry prefix, it’ll assume that it must be located at the Docker Hub.
An example session where we pull the Ubuntu image down from the Hub, and push it into our Registry. Notice that we qualify the “push to” and “pull from” requests on our registry by prefixing the hostname/port of our Registry:
$ sudo docker pull ubuntu:14.04
$ sudo docker tag 826544226fdc yourregistry.net:5000/ubuntu
$ sudo docker push yourregistry.net:5000/ubuntu
$ sudo docker pull yourregistry.net:5000/ubuntu
The tag command reserves a new spot in our registry for the given image from somewhere else. You’d get that ID string from the local listing.
By default, the Registry communicates only directly to the Docker socket or can be managed via REST. If you want to have an easier time of browsing your images, install the docker-registry-web project:
$ docker run -p 8080:8080 -e REG1=http://<system hostname>:5000/v1/ atcol/docker-registry-ui
Keep in mind that it’s going to need to be able to talk to your Registry instance, so make sure the hostname that you’re giving it for the registry is resolvable from within the docker-registry-web container.
A screenshot:
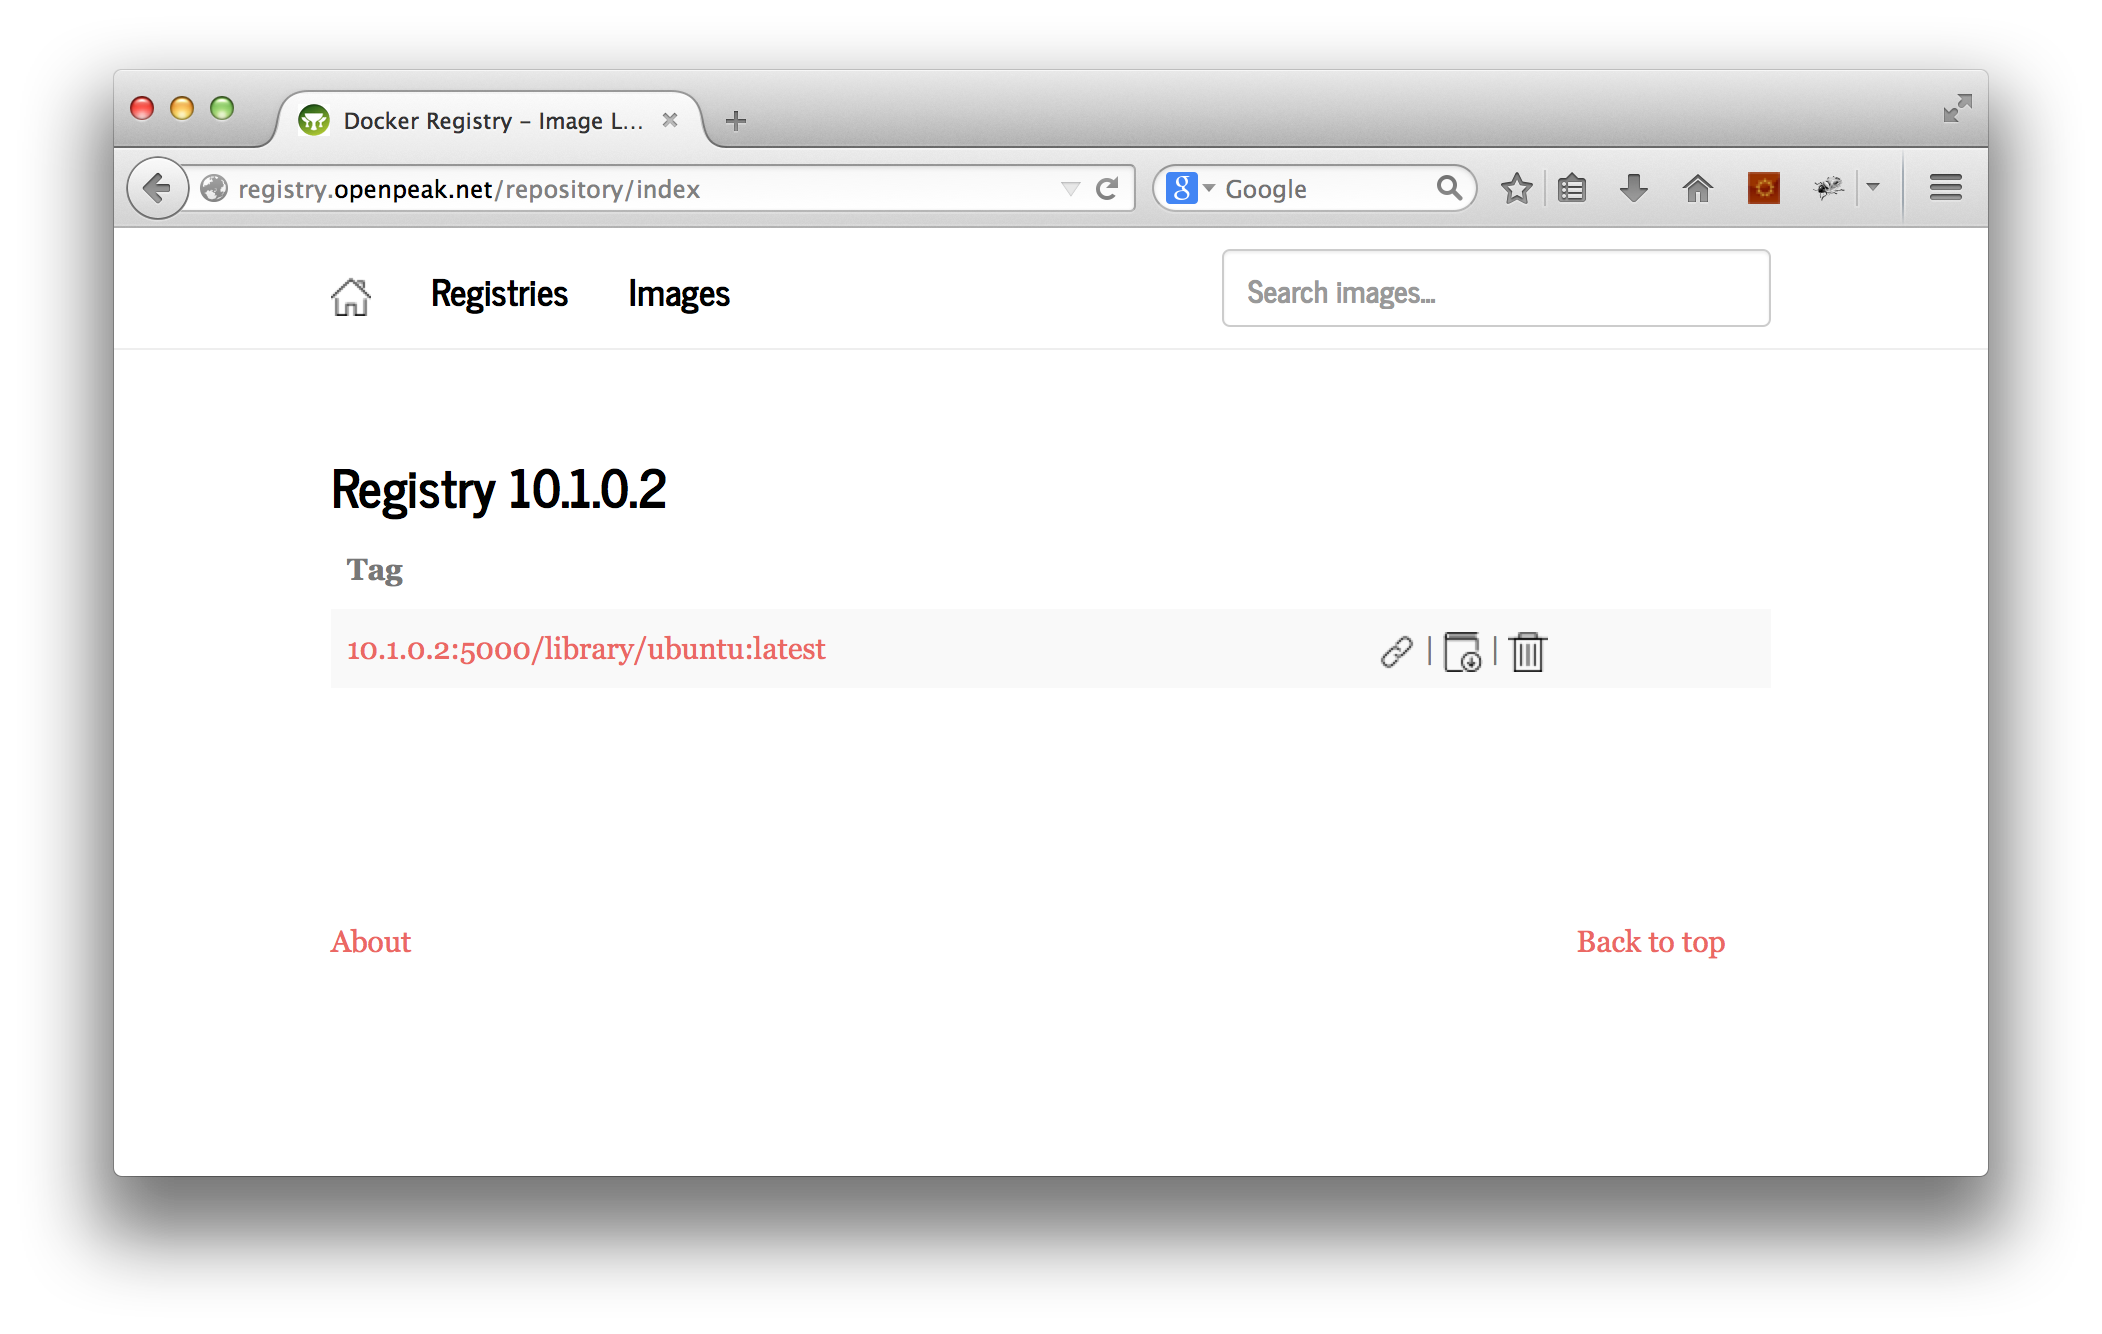
docker-registry-web is actually a Java application, but, again, it would be a poorly designed image if it was important for you to know that.
Lastly, when you’re done playing-around with your Registry instance, make sure to hide it behind an Nginx-proxy, and add authentication (mutual, HTTP, etc..).
Console-Based Markdown Presentation Tool
Where would we be without:
- Open-source people coming up with high-quality documentation
- Open-source people coming up with a better format to express pretty documentation in
- Open-source people constructing Github and advocating for pretty documentation
- Open-source people coming-up with a way to be able to appreciate this prettiness, even if you’re in a console?
Eat your heart out.
The Etymology of “Foo”
RFC 3092, baby:
Approximately 212 RFCs so far, starting with RFC 269, contain the
terms `foo', `bar', or `foobar' as metasyntactic variables without
any proper explanation or definition.  This document rectifies that
deficiency.
By extension, there is also “kruft” (which should be well into the general human vocabulary by now) and “kludge” (a technological shunt).
Underhanded Crypto Contest
Thanks to @zooko for retweeting about this. It’s fantastic and worthwhile.
Very Easy, Pleasant, Secure, and Python-Accessible Distributed Storage With Tahoe LAFS
Tahoe is a file-level distributed filesystem, and it’s a joy to use. “LAFS” stands for “Least Authority Filesystem”. According to the homepage:
Even if some of the servers fail or are taken over by an attacker, the
entire filesystem continues to function correctly, preserving your privacy
and security.
Tahoe comes built-in with a beautiful UI, and can be accessed via it’s CLI (using a syntax similar to SCP), via REST (that’s right), or from Python using pyFilesystem (an abstraction layer that also works with SFTP, S3, FTP, and many others). Tahoe It gives you very direct control over how files are sharded/replicated. The shards are referred to as shares.
Tahoe requires an “introducer” node that announces nodes. You can easily do a one-node cluster by installing the node in the default ~/.tahoe directory, the introducer in another directory, and dropping the “share” configurables down to 1.
Installing
Just install the package:
$ sudo apt-get install tahoe-lafs
You might also be able to install directly using pip (this is what the Apt version does):
$ sudo pip install allmydata-tahoe
Configuring as Client
- Provisioned client:
$ tahoe create-client
- Update ~/.tahoe/tahoe.cfg:
# Identify the local node.
nickname =

# This is the furl for the public TestGrid.
introducer.furl = pb://hckqqn4vq5ggzuukfztpuu4wykwefa6d@publictestgrid.e271.net:50213,198.186.193.74:50213/introducer
- Start node:
$ bin/tahoe start
Web Interface (WUI):
The UI is available at http://127.0.0.1:3456.
To change the UI to bind on all ports, update web.port:
web.port = tcp:3456:interface=0.0.0.0
CLI Interface (CLI):
To start manipulating files with tahoe, we need an alias. Aliases are similar to anonymous buckets. When you create an alias, you create a bucket. If you misplace the alias (or the directory URI that it represents), you’re up the creek. It’s standard-operating-procedure to copy the private/aliases file (in your main Tahoe directory) between the various nodes of your cluster.
- Create an alias (bucket):
$ tahoe create-alias tahoe
We use “tahoe” since that’s the conventional default.
-
Manipulate it:
$ tahoe ls tahoe:
$
The tahoe command is similar to scp, in that you pass the standard file management calls and use the standard “colon” syntax to interact with the remote resource.
If you’d like to view this alias/directory/bucket in the WUI, run “tahoe list-aliases” to dump your aliases:
# tahoe list-aliases
  tahoe: URI:DIR2:xyzxyzxyzxyzxyzxyzxyzxyz:abcabcabcabcabcabcabcabcabcabcabc
Then, take the whole URI string (“URI:DIR2:xyzxyzxyzxyzxyzxyzxyzxyz:abcabcabcabcabcabcabcabcabcabcabc”), plug it into the input field beneath “OPEN TAHOE-URI:”, and click “View file or Directory”.
Configuring as Peer (Client and Server)
First, an introducer has to be created to announce the nodes.
Creating the Introducer
$ mkdir tahoe_introducer
$ cd tahoe_introducer/
~/tahoe_introducer$ tahoe create-introducer .

Introducer created in '/home/dustin/tahoe_introducer'

$ ls -l
total 8
-rw-rw-r-- 1 dustin dustin 520 Sep 16 13:35 tahoe.cfg
-rw-rw-r-- 1 dustin dustin 311 Sep 16 13:35 tahoe-introducer.tac

# This is a introducer-specific tahoe.cfg . Set the nickname.
~/tahoe_introducer$ vim tahoe.cfg

~/tahoe_introducer$ tahoe start .
STARTING '/home/dustin/tahoe_introducer'

~/tahoe_introducer$ cat private/introducer.furl
pb://wa3mb3l72aj52zveokz3slunvmbjeyjl@192.168.10.108:58294,192.168.24.170:58294,127.0.0.1:58294/5orxjlz6e5x3rtzptselaovfs3c5rx4f
Configuring Client/Server Peer
- Create the node:
$ tahoe create-node
- Update configuration (~/.tahoe/tahoe.cfg).
- Set
nicknameandintroducer.furlto the furl of the introducer, just above. - Set the
sharesconfig. We’ll only have one node for this example, soneededrepresents the number of pieces required to rebuild a file,happyrepresents the number of pieces/nodes required to perform a write, andtotalrepresents the number of pieces that get created:shares.needed = 1 shares.happy = 1 shares.total = 1
You may also wish to set the
web.portitem as we did in the client section, above.
- Set
-
Start the node:
$ tahoe start
STARTING '/home/dustin/.tahoe'
- Test a file-operation:
$ tahoe create-alias tahoe
Alias 'tahoe' created

$ tahoe ls

$ tahoe cp /etc/fstab tahoe:
Success: files copied

$ tahoe ls
fstab
Accessing From Python
- Install the Python package:
$ sudo pip install fs
- List the files:
import fs.contrib.tahoelafs

dir_uri = 'URI:DIR2:um3z3xblctnajmaskpxeqvf3my:fevj3z54toroth5eeh4koh5axktuplca6gfqvht26lb2232szjoq'
webapi_url = 'http://yourserver:3456'

t = fs.contrib.tahoelafs.TahoeLAFS(dir_uri, webapi=webapi_url)
files = t.listdir()
This will render a list of strings (filenames). If you don’t provide
webapi, the local system and default port are assumed.
Troubleshooting
If the logo in the upper-lefthand corner of the UI doesn’t load, try doing the following, making whatever path adjustments are necessary in your environment:
$ cd /usr/lib/python2.7/dist-packages/allmydata/web/static
$ sudo mkdir img && cd img
$ sudo wget https://raw.githubusercontent.com/tahoe-lafs/tahoe-lafs/master/src/allmydata/web/static/img/logo.png
$ tahoe restart
This is a bug, where the image isn’t being included in the Python package:
logo.png is not found in allmydata-tahoe as installed via easy_install and pip
If you’re trying to do a copy and you get an AssertionError, this likely is a known bug in 1.10.0:
# tahoe cp tahoe:fake_data .
Traceback (most recent call last):
  File "/usr/lib/python2.7/dist-packages/allmydata/scripts/runner.py", line 156, in run
    rc = runner(sys.argv[1:], install_node_control=install_node_control)
  File "/usr/lib/python2.7/dist-packages/allmydata/scripts/runner.py", line 141, in runner
    rc = cli.dispatch[command](so)
  File "/usr/lib/python2.7/dist-packages/allmydata/scripts/cli.py", line 551, in cp
    rc = tahoe_cp.copy(options)
  File "/usr/lib/python2.7/dist-packages/allmydata/scripts/tahoe_cp.py", line 770, in copy
    return Copier().do_copy(options)
  File "/usr/lib/python2.7/dist-packages/allmydata/scripts/tahoe_cp.py", line 451, in do_copy
    status = self.try_copy()
  File "/usr/lib/python2.7/dist-packages/allmydata/scripts/tahoe_cp.py", line 512, in try_copy
    return self.copy_to_directory(sources, target)
  File "/usr/lib/python2.7/dist-packages/allmydata/scripts/tahoe_cp.py", line 672, in copy_to_directory
    self.copy_files_to_target(self.targetmap[target], target)
  File "/usr/lib/python2.7/dist-packages/allmydata/scripts/tahoe_cp.py", line 703, in copy_files_to_target
    self.copy_file_into(source, name, target)
  File "/usr/lib/python2.7/dist-packages/allmydata/scripts/tahoe_cp.py", line 748, in copy_file_into
    target.put_file(name, f)
  File "/usr/lib/python2.7/dist-packages/allmydata/scripts/tahoe_cp.py", line 156, in put_file
    precondition(isinstance(name, unicode), name)
  File "/usr/lib/python2.7/dist-packages/allmydata/util/assertutil.py", line 39, in precondition
    raise AssertionError, "".join(msgbuf)
AssertionError: precondition: 'fake_data' <type 'str'>
Try using a destination filename/filepath rather than just a dot.
See Inconsistent ‘tahoe cp’ behavior for more information.
Convert Syslog Events to a JSON Stream
The syslog-ng project serves as a general replacement for rsyslog (the default syslog daemon incarnation on Ubuntu and other distributions). It allows you to simply defining syslog sources, defining filters, defining destinations, and mapping them together. It also provides the ability to apply a pattern-tree to messages for classification (see “Processing message content with a pattern database” in the “Administrator Guide” PDF, below), as well as translating log messages into different formats.
It’s the latter that we’re concerned with. We can take Syslog output and use the JSON template-plugin to send JSON into a pipe, network destination, etc..
For this example, we’ll simply translate the system syslog events into JSON.
Installing/Configuring
- Install packages:
$ sudo apt-get install syslog-ng-core
$ sudo apt-get install syslog-ng-mod-json
- Modify /etc/syslog-ng/syslog-ng.conf:
destination d_json { file("/var/log/messages.json" template("$(format-json --scope selected_macros --scope nv_pairs)\n")); }; log { source(s_src); destination(d_json); }; - Restart the service:
$ sudo service syslog-ng restart
Now, you’ll see a /var/log/messages.json. Mine shows the following:
{"TAGS":".source.s_src","SOURCEIP":"127.0.0.1","PROGRAM":"sudo","PRIORITY":"notice","MESSAGE":"  dustin : TTY=pts/23 ; PWD=/home/dustin ; USER=root ; COMMAND=/usr/sbin/service syslog-ng restart","LEGACY_MSGHDR":"sudo: ","HOST_FROM":"dustinhub","HOST":"dustinhub","FACILITY":"authpriv","DATE":"Sep 16 04:51:41"}
{"TAGS":".source.s_src","SOURCEIP":"127.0.0.1","PROGRAM":"sudo","PRIORITY":"info","MESSAGE":"pam_unix(sudo:session): session opened for user root by dustin(uid=0)","LEGACY_MSGHDR":"sudo: ","HOST_FROM":"dustinhub","HOST":"dustinhub","FACILITY":"authpriv","DATE":"Sep 16 04:51:41"}
{"TAGS":".source.s_src","SOURCEIP":"127.0.0.1","SOURCE":"s_src","PROGRAM":"syslog-ng","PRIORITY":"notice","PID":"15800","MESSAGE":"syslog-ng shutting down; version='3.5.3'","HOST_FROM":"dustinhub","HOST":"dustinhub","FACILITY":"syslog","DATE":"Sep 16 04:51:41"}
{"TAGS":".source.s_src","SOURCEIP":"127.0.0.1","SOURCE":"s_src","PROGRAM":"syslog-ng","PRIORITY":"notice","PID":"15889","MESSAGE":"syslog-ng starting up; version='3.5.3'","HOST_FROM":"dustinhub","HOST":"dustinhub","FACILITY":"syslog","DATE":"Sep 16 04:51:41"}
{"TAGS":".source.s_src","SOURCEIP":"127.0.0.1","SOURCE":"s_src","PROGRAM":"syslog-ng","PRIORITY":"notice","PID":"15889","MESSAGE":"EOF on control channel, closing connection;","HOST_FROM":"dustinhub","HOST":"dustinhub","FACILITY":"syslog","DATE":"Sep 16 04:51:41"}
{"TAGS":".source.s_src","SOURCEIP":"127.0.0.1","PROGRAM":"sudo","PRIORITY":"info","MESSAGE":"pam_unix(sudo:session): session closed for user root","LEGACY_MSGHDR":"sudo: ","HOST_FROM":"dustinhub","HOST":"dustinhub","FACILITY":"authpriv","DATE":"Sep 16 04:51:41"}
Conclusion
This all enables you to build your own filter in your favorite programming language by using a socket-server and a set of rules. You don’t have to be concerned with parsing the Syslog protocol or the semantics of file-parsing and message formats, and you can avoid the age-old paradigm of parsing log-files, after the fact, by chunks of time, and start to process them in real-time.
Documentation
The syslog-ng website has some “Administrator Guide” PDFs, but the site has very little other usefulness, and, though everyone loves syslog-ng, there is little more than configurations snippets in forum posts. However, those PDFs are thorough, and the configuration file is easy to understand (essentially different incarnations of the commands above).

You must be logged in to post a comment.